Debug UEFI code by single-stepping your Coffee Lake-S hardware CPU
In the post I will cover:
- Configuring an ASRock H370M-ITX/ac to allow DCI DbC debugging
- Using Intel System Studio and System Debugger to single-step a Coffee Lake-S i7-8700 CPU
- Debugging an example exploitable UEFI application on hardware
USB DCI DbC Debugging (JTAG over USB3)
TL;DR, if you have a newer CPU & chipset you can purchase a $15 off-the-shelf cable and single-step your hardware threads. The cable is a USB 3.0 debugging cable; and is similar to an ethernet crossover cable in the sense that the internal wiring is crossed. Be careful with this cable as unsupported machines will have undefined behavior due to the electronics of USB.
Newer Intel CPUs support debugging over USB3 via a proprietary Direct Connection Interface (DCI) with the use of off-the-shelf hardware. This applies to some 6th-generation CPU and chipset combinations, and most 7th-generation and newer setups. I have not found the specific CPU/chipsec combinations but my educated guess from the Core series is as follows:
- Kaby Lake / Intel 100 or 200 series SunrisePoint
- Coffee Lake-S / Intel Z370, H370, H310, or B360
- Kaby Lake R / 6th-gen Intel Core
- Whiskey Lake-U (8565U, 8265U, 8145U)
- Coffee Lake-S / H370, H310, B360
These combinations should support “DCI USB 3.x Debug Class” debugging. This means you only need the inexpensive debug cable linked above. Note that if debug-cable debugging is not support then a proprietary interposing device is required via a purchase from Intel.
From the documentation I’ve read, the USB3 hardware on a supported machine decodes DCI commands, forwards them to an appropriate hardware module on the target CPU that translates them to JTAG sequences. Intel provides a free-to-use, renewably-licenced, Intel System Studio and System Debugger software along with a DCI implementation called OpenDCI. This debugging environment is built with Eclipse and supported on macOS, Linux, and Windows. I’ve only found OpenDCI support for DbC-compatible targets on the Windows version.
You will need a Windows 10 install and Intel System Studio if you are following along.
Enable DCI on the ASRock H370M-ITX/ac
TL;DR you will need to enable and disable undocumented settings within UEFI by flipping several bits in a UEFI variable.
If you are doing casual research on DCI you will find several references to using a BIOS version with DCI enabled or using a UEFI debug build. I am sure they will be very helpful but it is not possible to acquire this in a general sense. However, we can still follow guidance on “modding” our UEFI to enable DCI. I found eiselekd’s DCI-enable guidance extremely helpful.
- Use chipsec to dump your SPI contents to disk. e.g.,
chipsec_util spi dump rom.bin - Open rom.bin with UEFITool and extract GUID
899407D7-99FE-43D8-9A21-79EC328CAC21(the Setup UEFI variable). - Use IFRExtractor to print a textual representation of the variable options.
The variables settings required for the H370M-ITX/ac are as follows, tested on version 3.10 and 4.00 UEFI releases:
Enable/Disable IED (Intel Enhanced Debug): offset 0x960, set to enabled 0x1CPU Run Control: offset 0x663, set to enabled 0x1CPU Run Control Lock: offset 0x664, set to disabled 0x0Platform Debug COnnect: offset 0x114F, set to 0x03 to enable DCI DbCxDCI Support: offset 0xABD, set to enabled 0x1
To modify and save these offsets follow the guidance above to use the UEFI Shell and RU.efi application by James Wang.
You can confirm that DCI is enabled by reading the USB3 device class label when you connect the debug cable into your host and target machines. The host should have Intel System Studio installed and the target is the H370M-ITC/ac. The host USB driver will read “Intel USB Native Debug Class Devices” if DCI is enabled. If there is an error you will see “Port Reset Failed”. An easy way to view the detailed USB device information is with USB Tree View. Chipsec will also report if DCI is enabled but I found that DbC-specific availability is not reported; so use the USB device driver selection in Windows to confirm the UEFI options are set correctly.
Single-stepping the i7-8700
To recap the requirements and setup:
- You have a host machine running Windows 10 with Intel System Studio installed
- The host machine and target i7-8700/H370M-ITX/ac are connected via a USB3 DbC cabled
- The host machine shows a connected “Intel USB Native Debug Class Device” USB device
Interrupt the target machine’s boot such that you enter UEFI Setup (press F2). This is not required but it will help while following along with the address space and other layout details. I have not figured out how to halt the CPU on reset with DCI and DbC.
In Intel System Studio you should open System Debugger and configure your target connection to use “8th Gen Intel Core Processors (Coffee Lake-S) _ Intel H370 Chipset Intel H310 Chipset Intel B360 Chipset for Consumer (Cannon Lake PCH)” using the connection method: “Intel(R) DCI USB 3.x Debug Class”
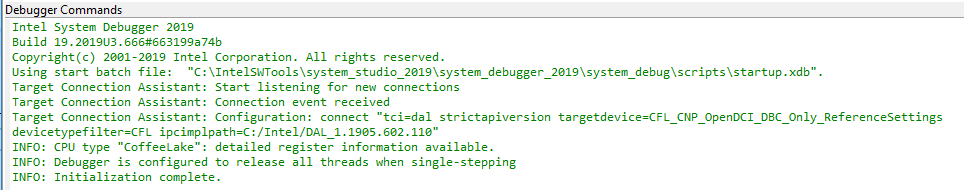
Upon success you will see status output similar to the following:
22:02:20 [INFO ] TCA - IPConnection: Open Connection, configuration: CFL_CNP_OpenDCI_DBC_Only_ReferenceSettings.
22:02:57 [INFO ] Starting DAL ...
22:02:57 [DAL  ] The system cannot find the batch label specified - SetScriptPath
22:02:58 [DAL  ] Registering MasterFrame...
22:03:00 [DAL  ] Using Intel DAL 1.1905.602.100
22:03:00 [DAL  ] Using python.exe 2.7.15 (64bit), .NET 2.0.50727.8940, Python.NET 2.0.19, pyreadline 2.1.1
22:03:02 [DAL  ]     Note:    The 'coregroupsactive' control variable has been set to 'GPC'
22:03:10 [DAL  ] Using CFL_CNP_OpenDCI_DBC_Only_ReferenceSettings
22:03:10 [DAL  ] >>? DAL startup completed
22:03:10 [INFO ] Connection Manager: Status change: CONNECTED
    Connection: 8th Gen Intel Core Processors (Coffee Lake-S) _ Intel H370 Chipset Intel H310 Chipset Intel B360 Chipset for Consumer (Cannon Lake PCH)
    Target: 8th Gen Intel Core Processors (Coffee Lake-S) / Intel H370 Chipset, Intel H310 Chipset, Intel B360 Chipset for Consumer (Cannon Lake PCH)
    Connection Method: Intel(R) DCI USB 3.x Debug Class
And output similar to the following screen captures:
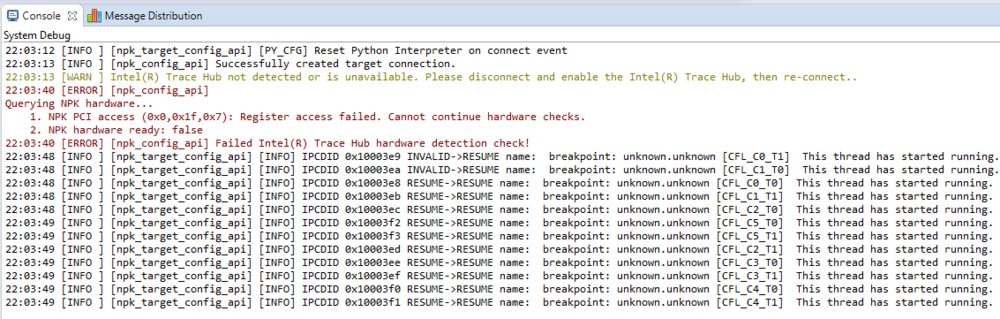
The connection will also pause the CPU threads and show you the nearby disassembly. If the CPU is not paused and clicking the “pause” button fails you have not enabled DCI completely. For example, if you encounter either, ExecutionControlUnableToHaltAllException, or operation not allowed while the processor is in state 'running' then double-check the UEFI Setup variable options.
A successful connection will show a UI similar to the following:
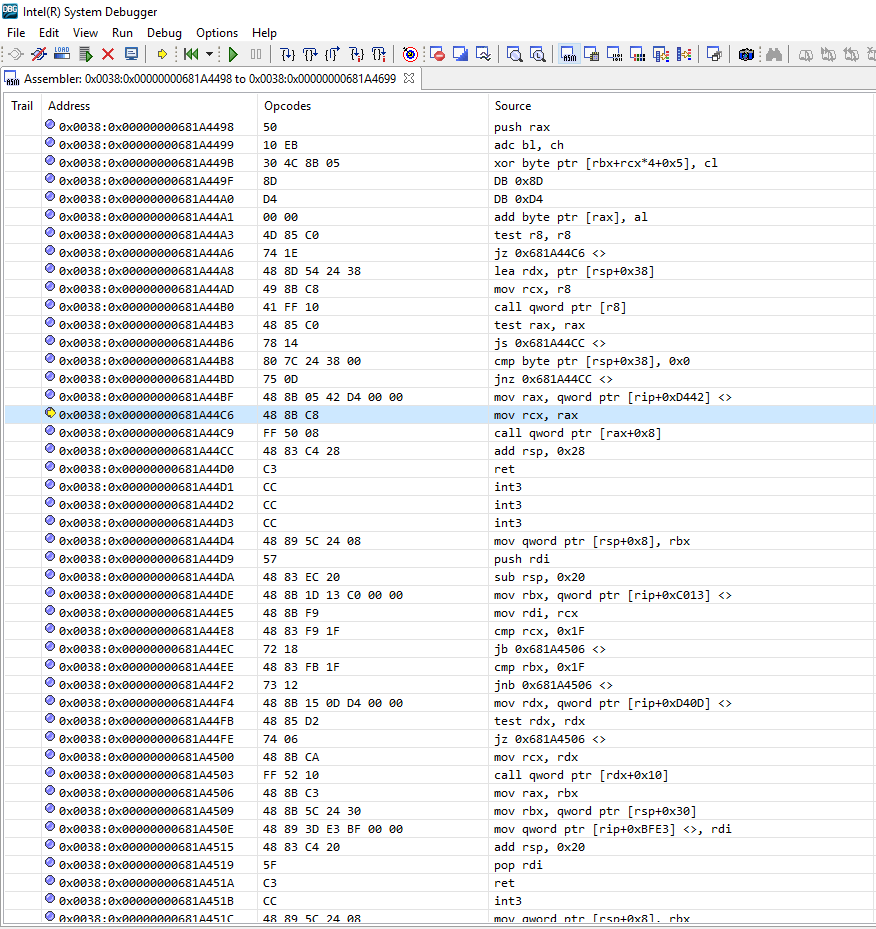
And you can now View and inspect memory as well as other common JTAG-debugging features.
Debugging an example exploitable UEFI application on hardware
TL;DR this is extremely simple and thus a great toy example, due to the lack of platform runtime security in UEFI and lack of build and compile security in the UEFI development kit (EDK/UDK).
The goal is to build a “toy” vulnerable UEFI application, trigger the exploitation, and observe the behavior within the System Debugger on the connected host. The first step is to configure the edk2 build environment. This is well-documented in several places.
I will modify the HelloWorld application and replace the MdeModulePkg/Application/HelloWorld/HelloWorld.c with the following content.
#include <Uefi.h>
#include <Library/UefiLib.h>
#include <Library/UefiApplicationEntryPoint.h>

#include <Protocol/LoadedImage.h>
#include <Library/UefiBootServicesTableLib.h>
#include <Library/MemoryAllocationLib.h>

VOID RunAsm();

CHAR16* GetArgv(IN EFI_HANDLE ImageHandle)
{
  EFI_LOADED_IMAGE* li;
  EFI_GUID loaded_image_protocol = LOADED_IMAGE_PROTOCOL;
  gBS->HandleProtocol(ImageHandle, &loaded_image_protocol, (void**) &li);

  CHAR16* wargv = (CHAR16 *)li->LoadOptions;
  return wargv;
}

VOID RunMe()
{
  Print(L"You win\n");
  RunAsm();
}

UINT32 StrLenChar(CHAR8* src) {
  UINT32 ret = 0;
  while (src[ret++] != 0) {}
  return ret - 1;
}

VOID StrCpy(CHAR8* dst, CHAR16* src, UINT32 length) {
  CHAR8 *src8 = (CHAR8*)src;
  for (UINT32 i = 0; i < length; i++) {
    dst[i] = src8[(i*2)];
  }

  UINT64 loc = (UINT64)&RunMe;
  dst[length - 1] = 0;
  dst[length - 2] = 0;
  dst[length - 3] = 0;
  dst[length - 4] = 0;
  dst[length - 5] = ((loc >> (8 * 3)) & 0xFF);
  dst[length - 6] = ((loc >> (8 * 2)) & 0xFF);
  dst[length - 7] = ((loc >> (8 * 1)) & 0xFF);
  dst[length - 8] = ((loc >> (8 * 0)) & 0xFF);
}

 __attribute__((noinline)) VOID
 TestBufferOverflow(CHAR16* input)
 {
  /* Test stack buffer overflow */

  // Compiled with EDKII that auto-adds (-fno-stack-protector)
  CHAR8 buffer[32];
  StrCpy((CHAR8*)buffer, input, StrLen(input));
  buffer[StrLen(input)] = 0;
}

EFI_STATUS EFIAPI UefiMain (
  IN EFI_HANDLE        ImageHandle,
  IN EFI_SYSTEM_TABLE  *SystemTable
) {
  // Run with: fs0:X64\HelloWorld.efi A*222

  Print(L"UefiMain=0x%p\n", &UefiMain);
  CHAR16* wargv = GetArgv(ImageHandle);
  UINT32 wargv_len = StrLen(wargv);
  TestBufferOverflow(wargv);

  return EFI_SUCCESS;
}
The specific build command is
$ . ./edksetup.sh BaseTools
$ build -m MdeModulePkg/Application/HelloWorld/HelloWorld.inf -p MdeModulePkg/MdeModulePkg.dsc
And if you would like to test that this runs follow the QEMU debugging guide and use:
$ qemu-system-x86_64 -bios /usr/share/OVMF/OVMF_PURE_EFI.fd -display none -nodefaults -serial stdio -hda fat:Build/MdeModule/DEBUG_GCC5
The code above is a sythethetic stack-based buffer overflow example. It will auto-fill in the overwritten ret address for you. If you want to learn what is happening here please read Dhaval’s articles on Buffer Overflows. As a note, we could choose to make this more realistic (e.g., remove the auto-filled ret) by reading a file into the vulnerable stack variable.
The default edk2 build configuration will compile the overflow into the following flow, where the StrCpy logic is inlined:
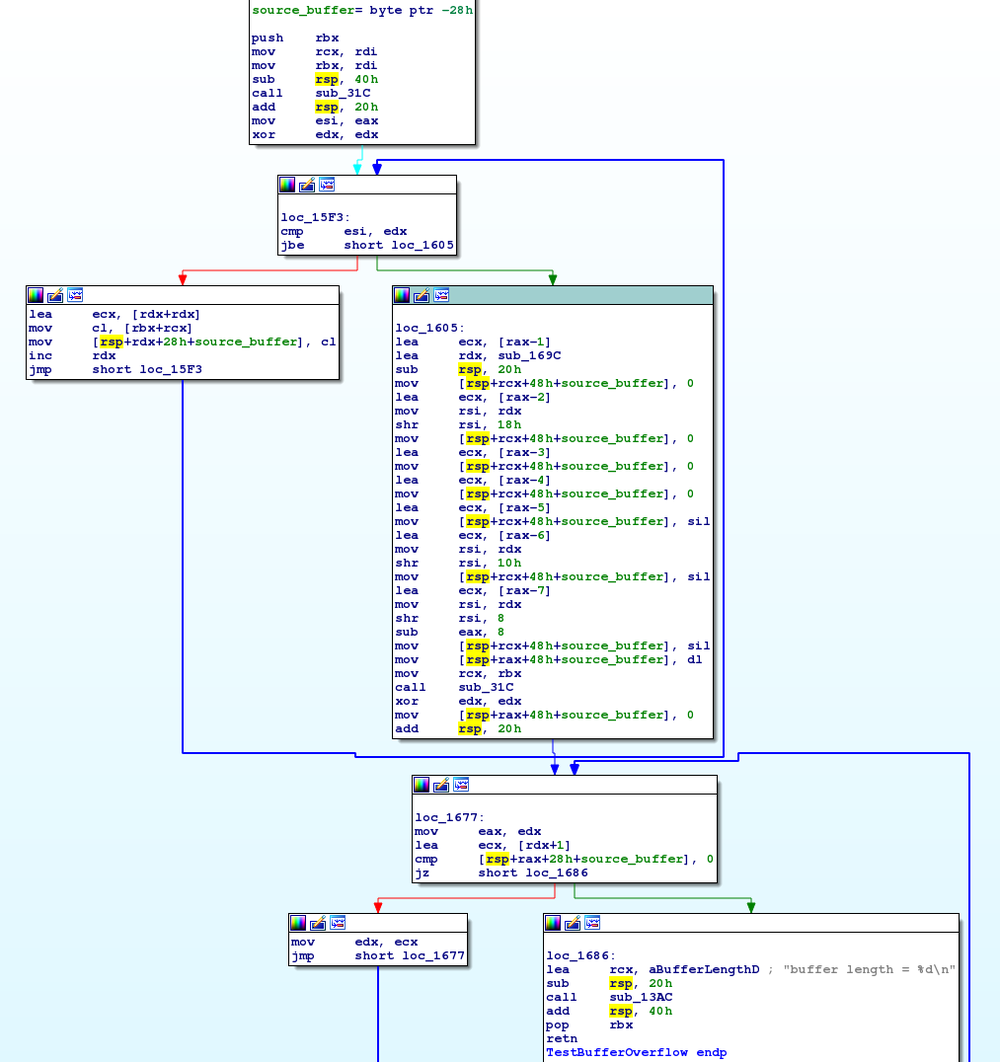
Our goal is to copy 0x30 characters into the buffer, overflowing the expected 0x20, the 8 for the saved RBX, and 16 for RSP and RIP; at which point the final 8 will be filled in with the address of RunMe.
For some fast feedback we’ll print to ConsoleOut then reset the CPU using:
ASM_GLOBAL ASM_PFX(RunAsm)
ASM_PFX(RunAsm):
    mov $254, %al
    out %al, $100
    ret
If a console is not available then this functions well for blind-testing control of rip.
Because we are printing the location of UefiMain we can both confirm that each time the application is executed the address is constant and know what location to set a hardware breakpoint in System Debugger so we can single-step and watch the overflow.
For my UEFI build this location was 0x600BC69C, which means the .text is loaded to an offset of 0x600BB000 as this subroutine is 0x169C. From here we can add more breakpoints in System Debugger.
For more information about DCI and why you should keep it disabled unless explicitly debugging, please read Intel DCI Secrets from Positive Technologies presented at HITBSecConf 2017.